Ephraim K. - Expert Data Analyst - Power BI, SQL, Py & Excel Experience

Ephraim K.

Expert Data Analyst - Power BI, SQL, Py & Excel Experience

Kenya | Africa/Nairobi (USD)

$35/hr
Full-time : 30+ hrs/week
0, Followers

ABOUT ME

I am an expert Data Analyst with years of experience in Data Modeling and Analytics, ETL Pipelines, end-to-end solutions in Microsoft Power BI, Databases, and Data Warehouses (SQL Server, BigQuery, MySQL), and Data Analytics consultancy. I am also big in Machine Learning (Python, Google Colab), with a specific interest in Predictive Models.

I speak to data and make it talk back with valuable insights for your managerial, growth, or bottom-line decisions.
I have diverse academic knowledge in finance, statistics, and actuarial science.
Currently, I have low rates to get me started here as a newbie - be sure to jump on this!
I can guarantee:
✔ Power BI (DAX & M Coding | PowerQuery | API Integration| PBI Service | Power BI Reporting Service) ✔ Power Automate
✔ MySQL, SQL, SSRS, SSIS
✔ Excel (Macros | VBA)
✔ ML in Python
✔ IBM SPSS (Exploratory Analysis | Statistical Analysis | Descriptive)
✔ XLSTAT (Exploratory Analysis | Statistical Analysis | Descriptive)
SKILLS

EMPLOYMENT HISTORY OUTSIDE OF TOOGIT

Actuarial Analyst

CIC Insurance Company - Dec, 1970 to Dec, 2020, Nairobi

EDUCATION HISTORY

Actuarial Science and Statistics, Mathematics, Statistics

(2014 - 2018) Maseno University
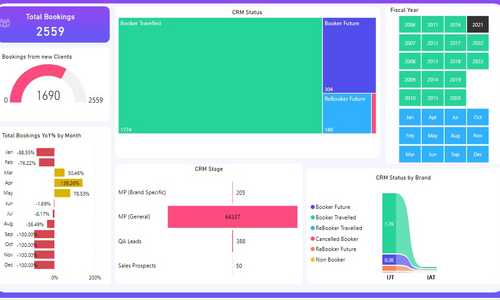
The primary purpose of the project was to show the makeup of the CRM across time, based on 6 CRM Statuses (Booker Travelled, Booker Future, ReBooker Travelled, ReBooker Future, Non Booker, and Cancelled Bookers), and 3 CRM Stages (Qualified Active Lead, Marketing Prospect, and Sales Prospect). I created highly dynamic dashboards to achieve the aforementioned objective using time intelligence reporting, UX, and multiple filtering across Brands, Users, among other categories within the established data model .
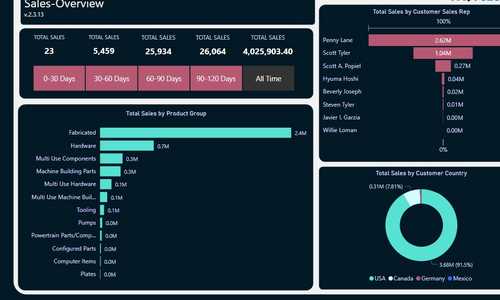
-The sales split by items such as Country, Salesperson, Product Group – with dynamic slicers-Time intelligence visualization to show how much was sold in the last 30, 60, 90 days etc-Trends were more interesting: -Performance this month vs last month (am I doing better? Or worse?) (by product, country)- dynamic charts to allow toggling between absolute and cumulative sales amounts -Performance this month vs the same month last year -Dynamic slicers to show this year, this month, and this quarter sales performance across product group and country filters
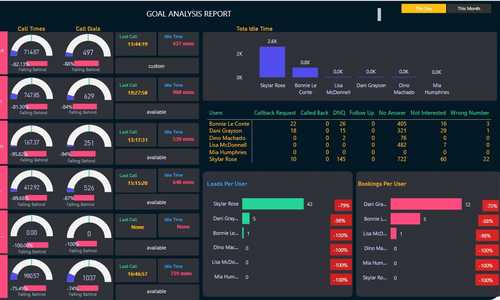
The purpose of the project was to create a live dashboard for call data to show the performance of agents across metrics such as talking time, idle times, leads generated, booking made, number of dials, and call durations. These analytics were meant to serve as a base for creating competition among agents in hitting targets created. One data source was used, that is, an API. The report was developed to dynamically show the changes in target achievements in combination with row-based time intelligence (daily, weekly, monthly). The report was published on both Power BI service (Cloud), and Power BI Reporting Service (On-premise) to allow dynamic sharing and access in the organization.