Michael C. - Business Intelligence Analyst

Michael C.

Business Intelligence Analyst

Kenya | Africa/Nairobi (USD)

$3/hr
Part-time:10-30 hrs/week
0, Followers

ABOUT ME

I am a self-motivated, enthusiastic and keen to detail person. I have a background in Statistics; a holders Bachelor’s Degree in Statistics, a Postgraduate Diploma in Applied Statistics and a Master of Science in Project Monitoring and Evaluation.
I have experience in data entry, data collection and monitoring, data cleaning and auditing, data analysis using statistical tools like Excel, Google Sheets, R, Python.... I also have experience in report compilation and data visualization tools like; Tableau, Power-BI, Google Data Studio… that I have demonstrated while working at Data Fintech as the Lead Real Estate Data Analyst, at Kutoka Ardhini as the Business Intelligence Analyst, at RBM as a Admin Virtual Assistant and as a Freelance Data Analyst. I have excellent time management skills and am able to work with minimal or no supervision. I am a team player and above all I am flexible enough to fit into your work hours.
I have proven myself that I can handle anything that relates to data.

Upon speaking with me, you will get to understand my passion to the role and career choice as a Data (Business Intelligence) Analyst and I can guarantee that I will give 100% in any task awarded to me.

SKILLS

EMPLOYMENT HISTORY OUTSIDE OF TOOGIT

Business Intelligence Analyst

Kutoka Ardhini - Sep, 2019 to present, Nairobi

Lead Real Estate Market Analyst (East Africa Region)

Data Fintech - Nov, 2017 to Dec, 2018, Nairobi

Freelance Data Analyst

Fiverr INC - May, 2016 to present, Nairobi

Virtual Assistant (Data Monitor and Analyst)

Results Based Marketer - Jan, 2018 to Jan, 2020, San Francisco

EDUCATION HISTORY

Bachelor of Science , (Bsc) Statistics

(2011 - 2014) Jomo kenyatta University of Agriculture and Technology

Post Graduate Diploma , (Pgd) Applied Statistics

(2015 - 2017) Jomo kenyatta University of Agriculture and Technology

Master of Science , (Msc) Project Monitoring and Evaluation

(2018 - 2020) Kenyatta University
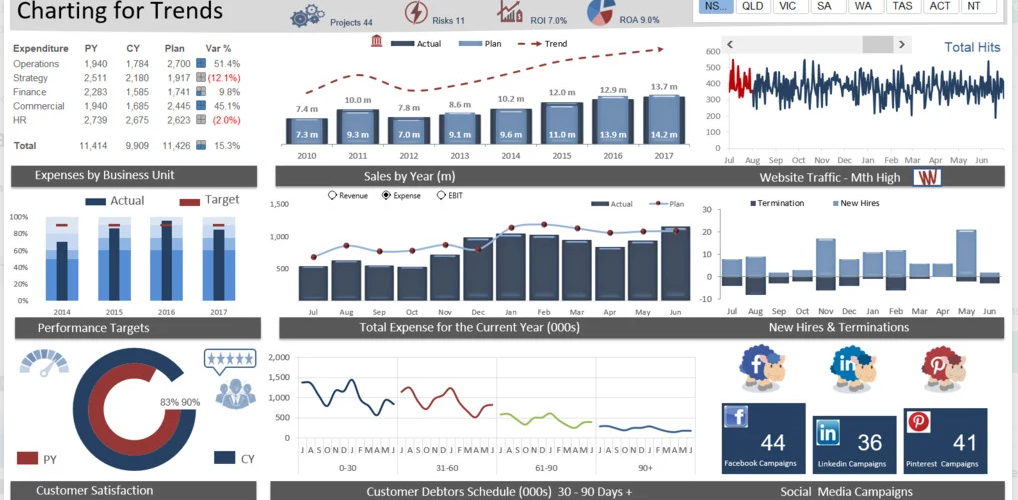
The data was from the sale and advertisement of products for an E commerce company. The purpose of the dashboard was to visualize the sales and ads spend by product and by sales period. Dashboard through Google Data Studio
The data was from the sale and advertisement of products for an E commerce company. The purpose of the dashboard was to visualize the sales and ads spend by product and by sales period. Dashboard through Google Sheets
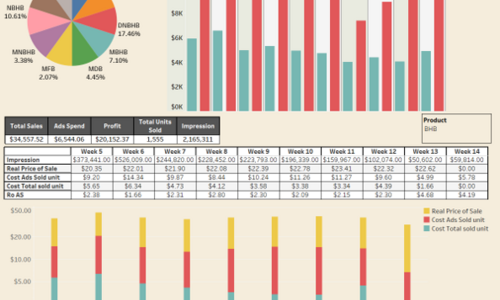
The data was from the sale and advertisement of products for an E commerce company. The purpose of the dashboard was to visualize the sales and ads spend by product and by sales period. Dashboard through Tableau
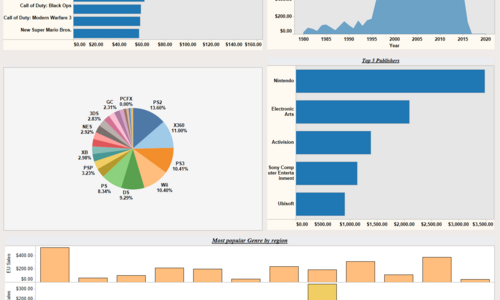
The excel dateset contains information about video game sales I want to visualize: 1. Top 10 video games of all time 2. Which Genre is most popular- the genre sales should be broken down by region. (e.g. using a map, bar/scatter/line/pie plot...) 3. Which publisher to pick based on which genre a game is. Your chart should provide a clear top publisher for each genre (could be interactive or statically show) I need: 1. 3 graphs (colored) answering the questions above. They should be different from each other (e.g. bar, scatter, pie...) 2. Some form of interactivity (e.g. filters that updates the graphs/look of the dashboard). Tableau Dashboard